2024-25 Test Prep Results
I work with a small number of students at a time so each plan can be genuinely personalized! Here’s a snapshot of outcomes from my 2024-2025 students (anonymous data; individual results vary).
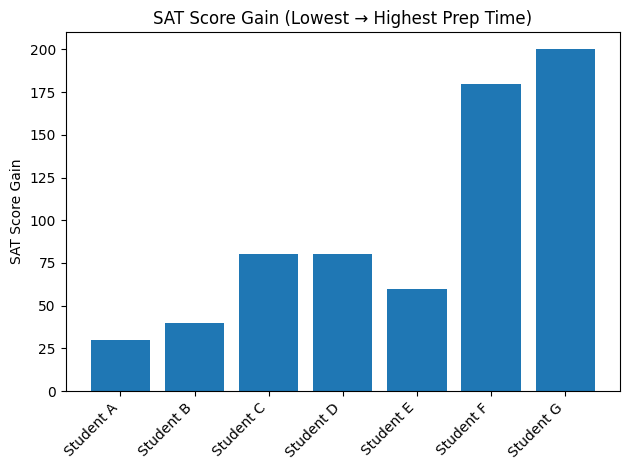
SAT
Average improvement: +94 points (range of +30 to +200)
Average percentile increase: +14 points
Average total structured prep time: ~9 hours
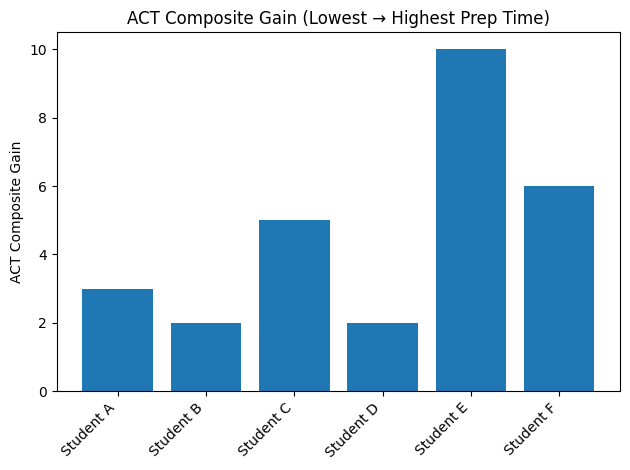
ACT
Average improvement: +4.7 composite points (range of +2 to +10)
Average percentile increase: +18 points
Average total structured prep time: ~9 hours
Most Improved Students
SAT
+200 points, +36 percentile increase
ACT
+10 composite points, +30 percentile increase
What can you expect for your student?

Schedule Accommodation
Every student has a different starting point and schedule. The plan I designed for each student accommodated their busy lives, even though most were student-athletes in the study.
Consistency
The students who saw the largest increases were those who were consistent and worked together the longest. I aim to work with each student to build confidence and a sustainable routine for even the busiest students.
Personal Growth
Even my most high-performing students saw a significant increase and are represented in the data. Having well-structured and critical feedback from a test prep expert can be the difference between a 94th percentile score and 97th. Even the brightest students may need a coach to help them be most efficient with their time!